Data-driven insights on social: why formula beats frequency across 80,000 posts
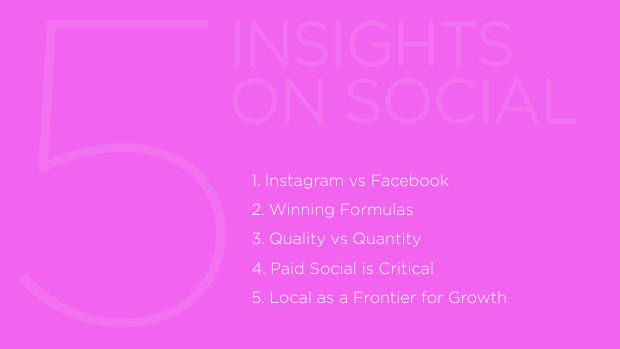
This report distils Totem's APAC social study of roughly 80,000 posts into five data-backed insights on what actually drives performance on social media. The through-line is that most brands manage social with all-too-logical planning — copying competitors, balancing a wide mix of themes across a tidy calendar — and that this rational approach caps results. What wins is a distinctive, consistently executed "winning formula" that gives audiences a clear reason to follow.
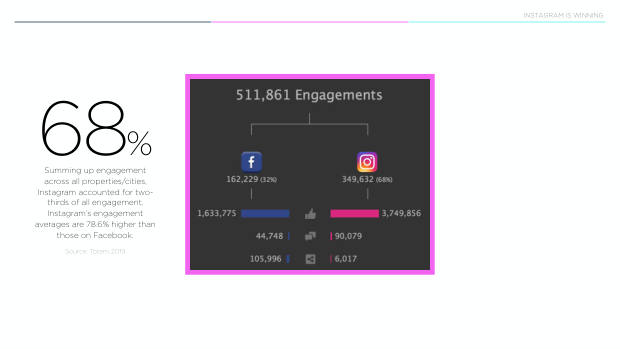
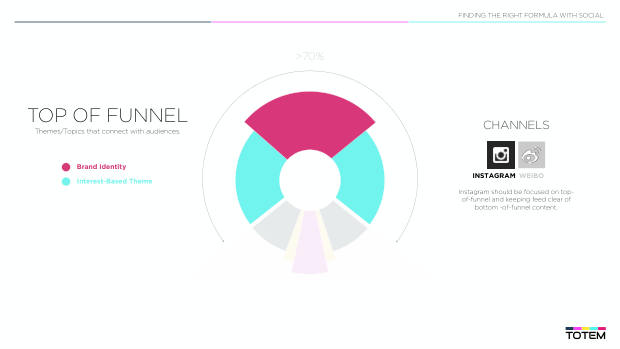
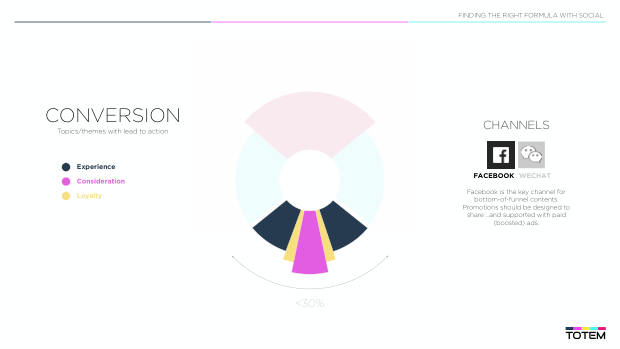
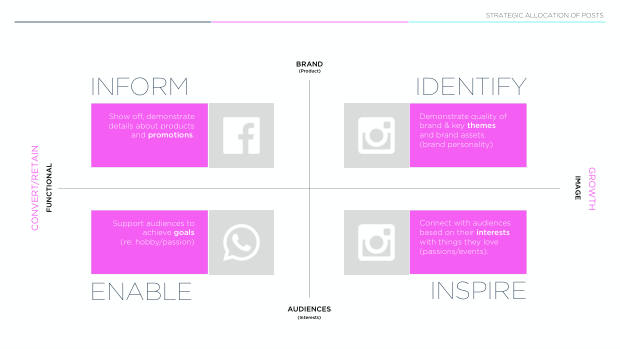
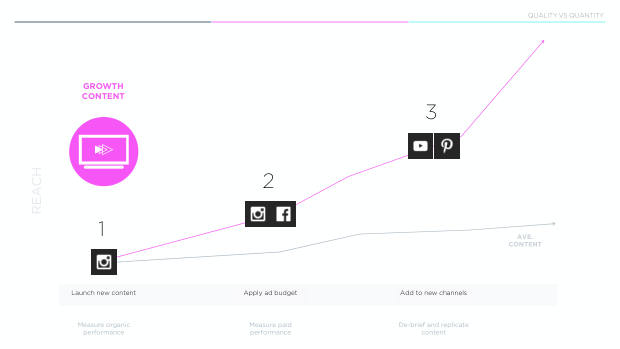
The channel picture is decisive. Summed across all properties and cities, Instagram accounted for two-thirds of engagement, with per-post engagement averages 78.6% higher than Facebook. The two platforms play different roles: Instagram is a top-of-funnel brand and affinity engine (kept clear of bottom-of-funnel content), while Facebook is the conversion and promotions channel, best supported with paid boosting.
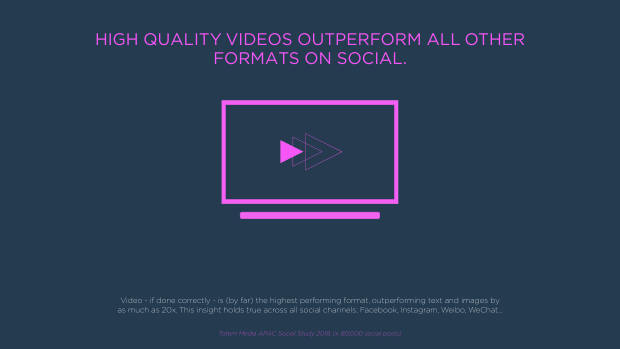
Format and context compound the effect. High-quality video, done well, outperforms text and images by as much as 20x across channels — but quality matters more than format, and the best still image beats an average video. Localised, timely content adds an 8% average lift (20-30%+ when production quality matches global), and clustering posts into thematic bursts can double fan growth and retention.
Instagram is winning over Facebook.
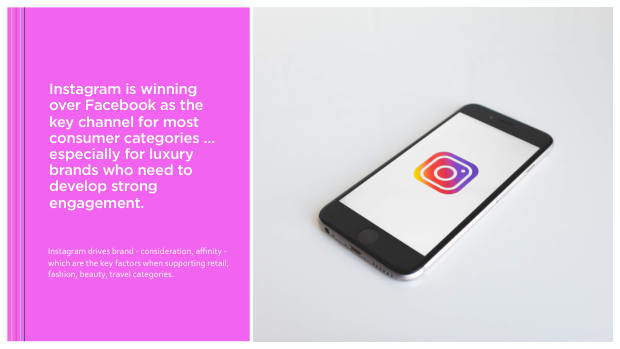
Across categories — especially luxury — Instagram drives the bulk of engagement, capturing two-thirds of the total with per-post averages 78.6% higher than Facebook. Instagram's role is to build consideration and affinity at the top of the funnel; Facebook's is to convert and share promotions, best supported with paid ads.
Brands must lock in a winning formula.
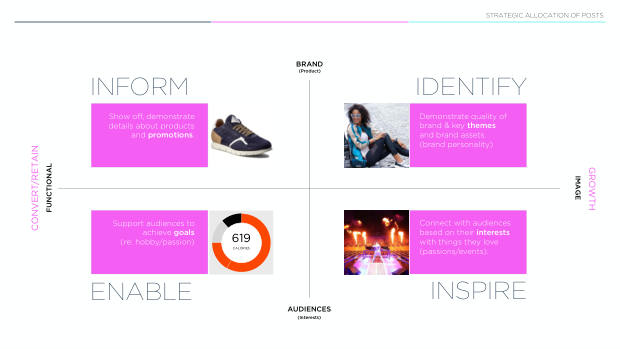
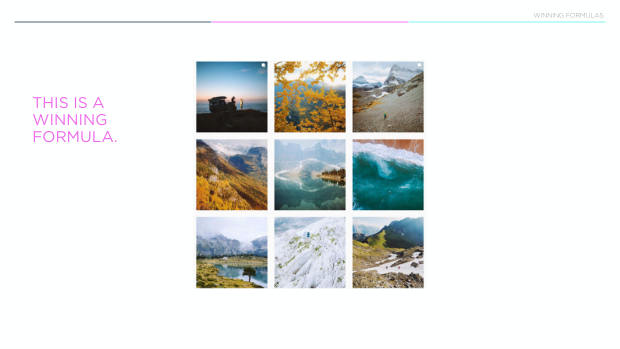
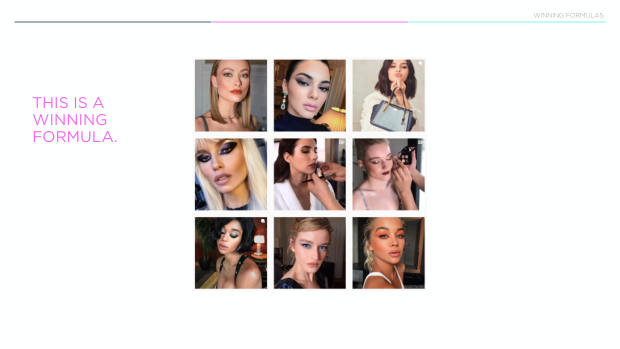
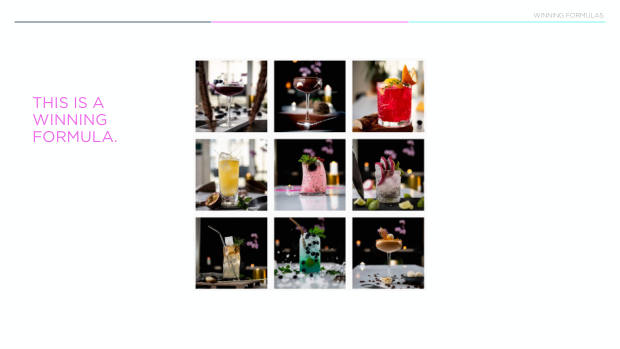
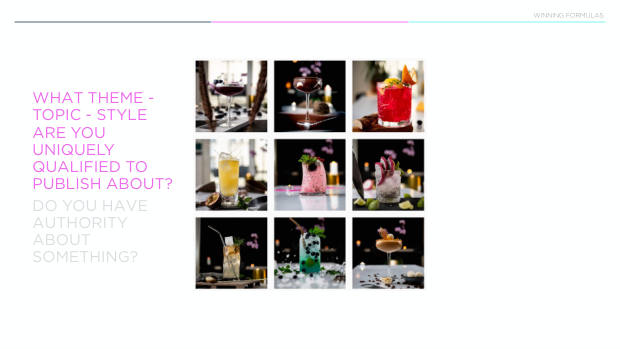
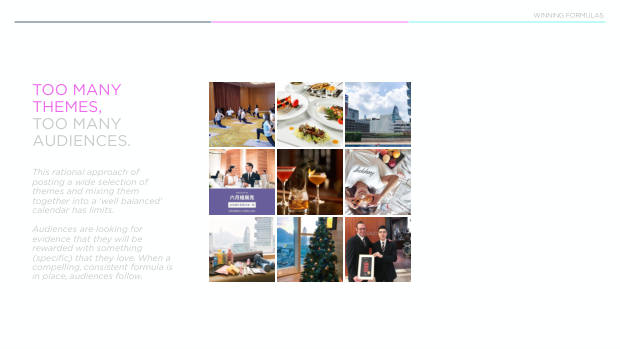
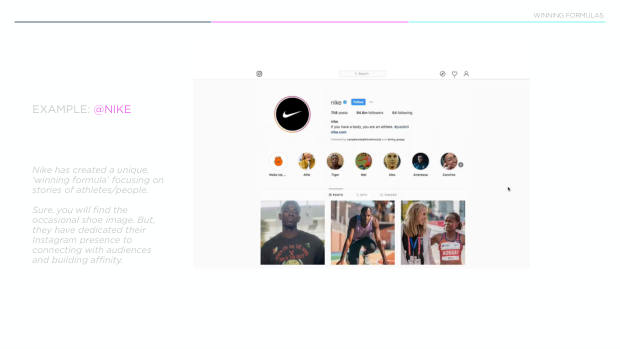
A winning formula is the specific themes, topics and design elements that make an account unique and worth following. Most brands dilute this with too many competing themes and audiences. Audiences follow when they see evidence of a consistent, distinctive promise being kept — Nike's athlete-story-led Instagram is cited as an example of formula over product shots.
Cluster content into thematic bursts.
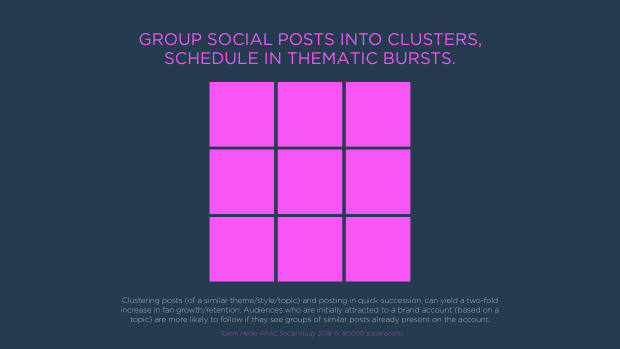
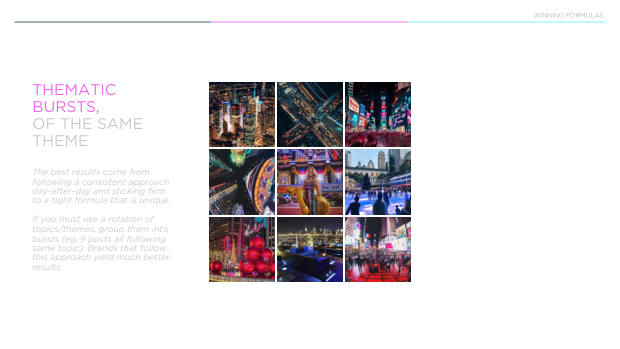
Grouping posts of a similar theme, style or topic and scheduling them in quick succession can yield a two-fold increase in fan growth and retention. Audiences drawn in by one topic are far more likely to follow if they see more of the same already present — a rotation of nine posts on one theme beats a mixed calendar.
Quality outranks format — and both can work.
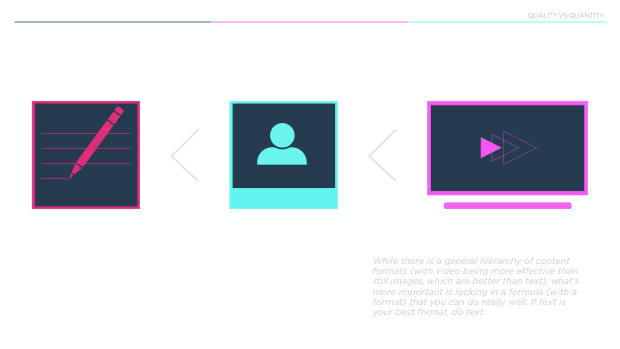
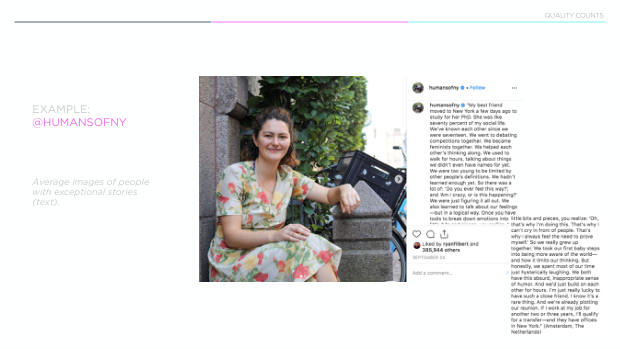
There is a general hierarchy (video over stills over text), and high-quality video can outperform other formats by up to 20x across Facebook, Instagram, Weibo and WeChat. But content quality drives engagement more than format: the best still images beat average-quality video, and text done well still delivers. The advice is to pick the format you can execute best and commit.
Paid social is now essential — and can lift organic.
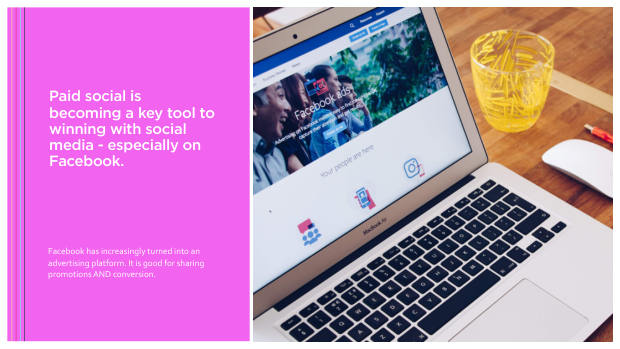
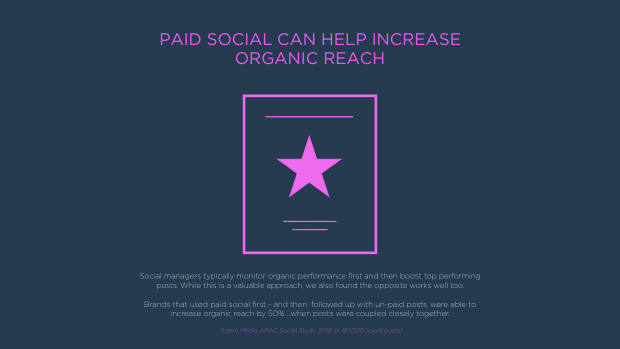
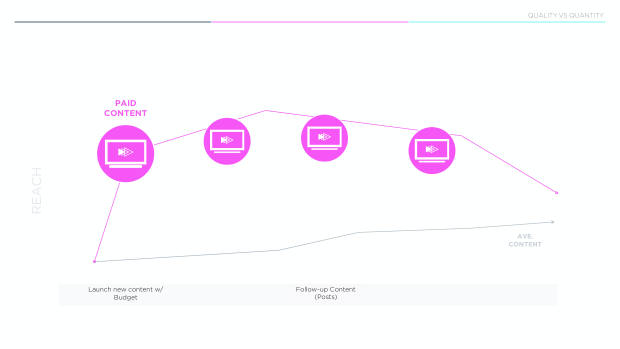
Facebook has become an advertising platform, valuable for sharing promotions and conversion. Beyond the usual approach of boosting proven organic posts, Totem found the reverse also works: brands that ran paid social first and followed with closely coupled unpaid posts increased organic reach by 50%.
Local content is the next frontier.
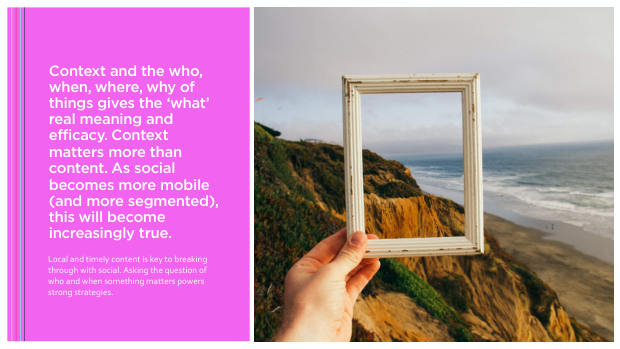
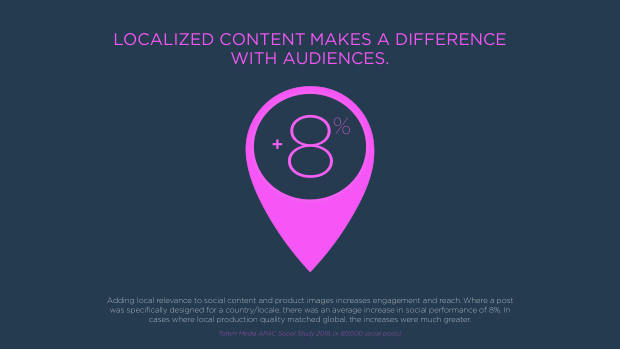
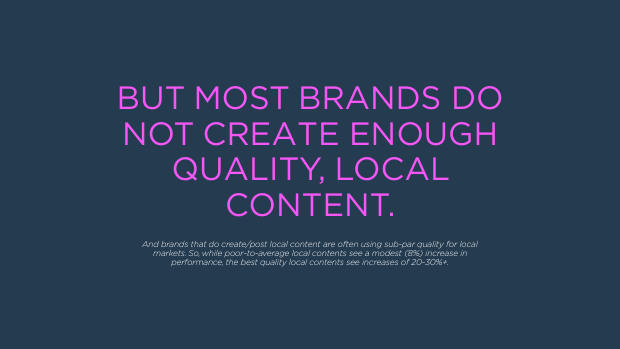
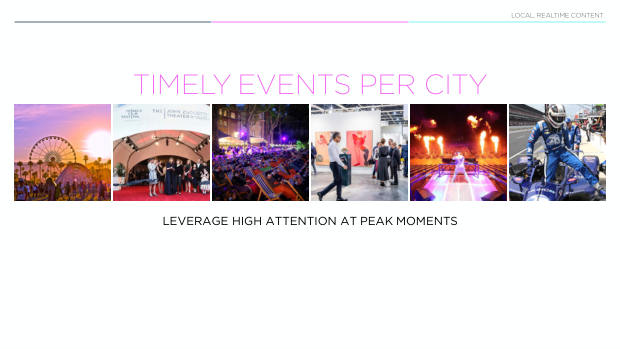
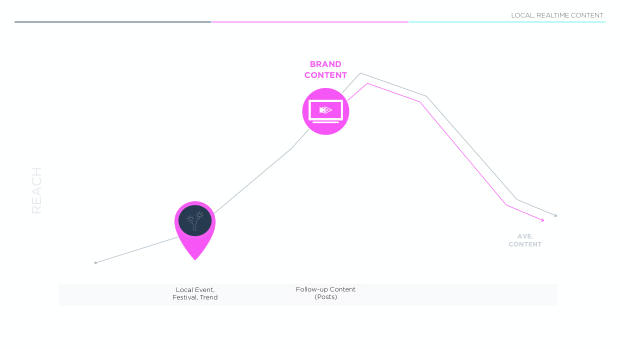
Context — the who, when and where — gives content meaning, and matters more than content itself as social becomes more mobile and segmented. Posts designed for a specific country or locale saw an average 8% performance uplift; where local production quality matched global standards, the increases reached 20-30%+. Most brands, however, under-invest and post sub-par local content.


Which platform matters most for engagement?
Instagram. Across all properties and cities studied it captured about 68% of engagement, with per-post averages 78.6% higher than Facebook. Instagram builds brand and affinity; Facebook is better for conversion and promotions.
Does video always win on social?
Not always. High-quality video can outperform text and images by up to 20x, but quality beats format — the best still image outperforms an average-quality video. Brands should commit to the format they can execute best.
What is a "winning formula"?
The distinctive combination of themes, topics and design that makes an account unique and gives audiences a clear reason to follow. Most brands undermine it by covering too many themes for too many audiences.
How can brands get more from the same content?
Cluster similar posts into thematic bursts to roughly double fan growth and retention, and use paid social ahead of coupled organic posts to lift organic reach by around 50%.
Does localising content pay off?
Yes. Content designed for a specific locale lifts performance by about 8% on average, rising to 20-30%+ when local production quality matches global standards — but most brands post sub-par local content and leave that gain on the table.
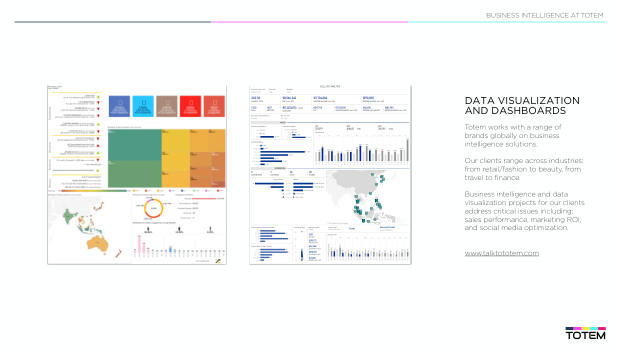
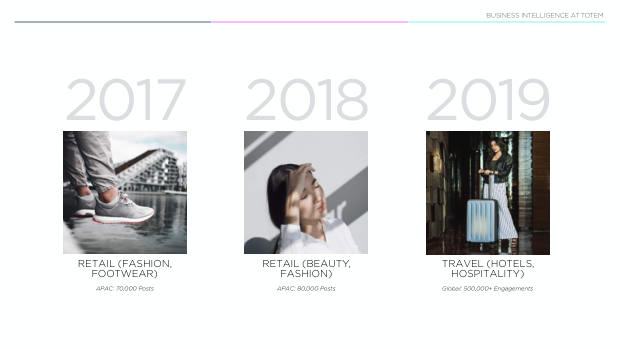
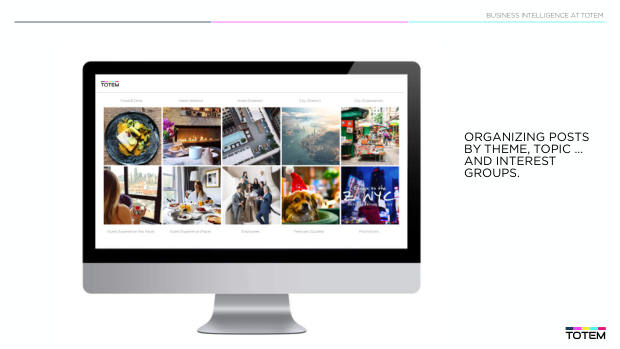
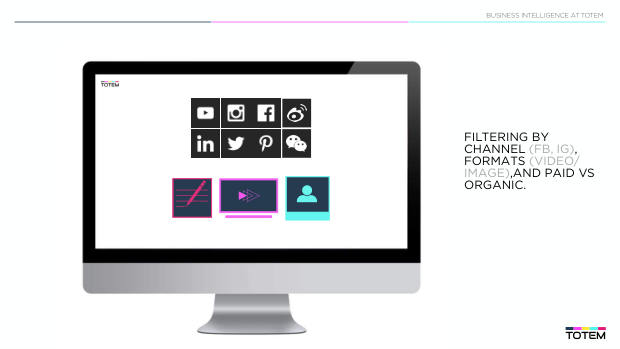
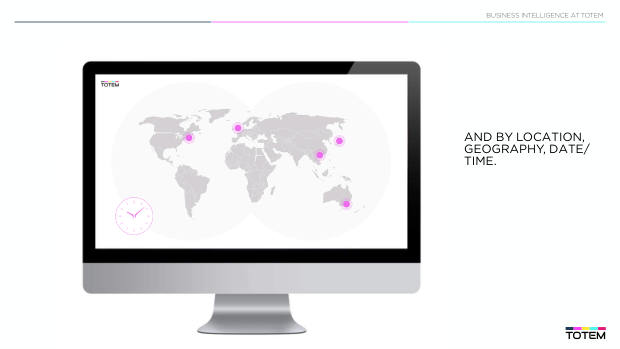
The insights are drawn primarily from Totem Media's APAC social study of approximately 80,000 social posts (2018), spanning retail, fashion, footwear, beauty, travel and hospitality across Facebook, Instagram, Weibo and WeChat, and complemented by Totem's business-intelligence and data-visualisation work for brands. Posts were tagged and organised by theme, topic, channel, format (video/image), paid versus organic, location and time, then analysed for relative performance to isolate the drivers of engagement, reach and fan growth.
Get the full report
Leave your details — we'll email you the PDF and give you the download straight away.