China · Special report · Totem × Meltwater · 2024

Geographic Analysis of China's Global Brands: where they're winning, and where sentiment still resists

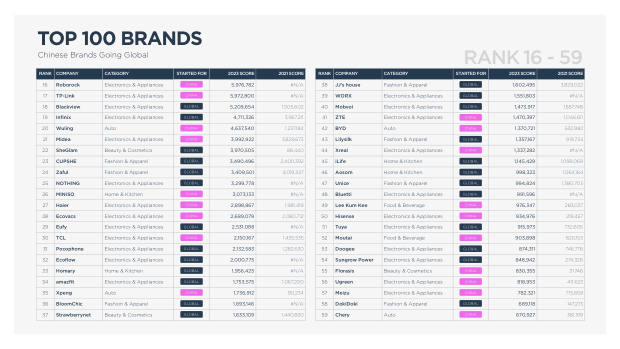
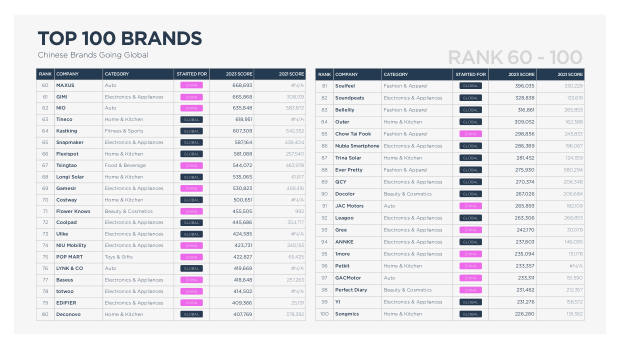
Building on Totem's 2024 Top 100 ranking, this special report with Meltwater pulls global data on China's 100 top-ranked brands across seven regions and over 170 countries. It maps where Chinese brands are succeeding, how local consumers respond, which channels and influencers work per market, and what the leading brands are doing on the ground — case study by case study.

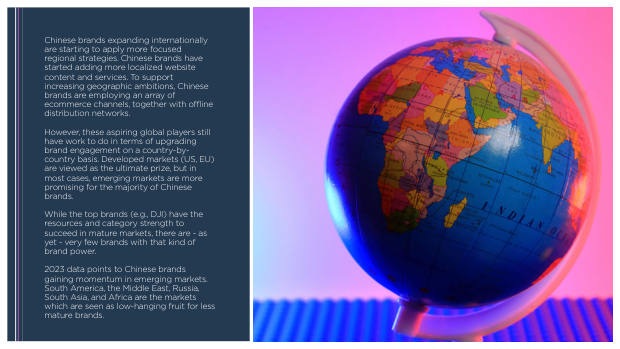
The through-line is uneven geographic maturity. Developed markets (US, EU) are viewed as the ultimate prize, but for most brands emerging markets are the more promising near-term fit. Only a handful of brands — DJI foremost — have the category strength to win in mature markets outright. The rest are gaining momentum where barriers are lower: South America, the Middle East, Russia, South Asia and Africa read as low-hanging fruit.

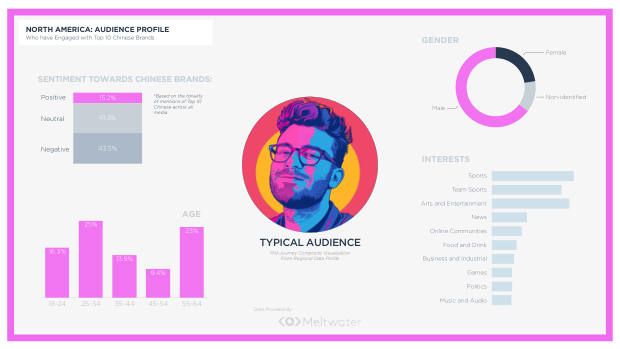
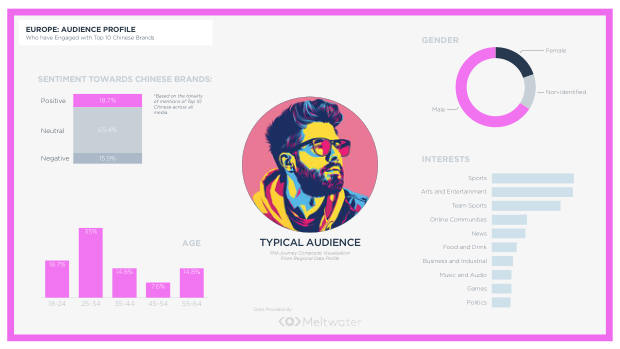
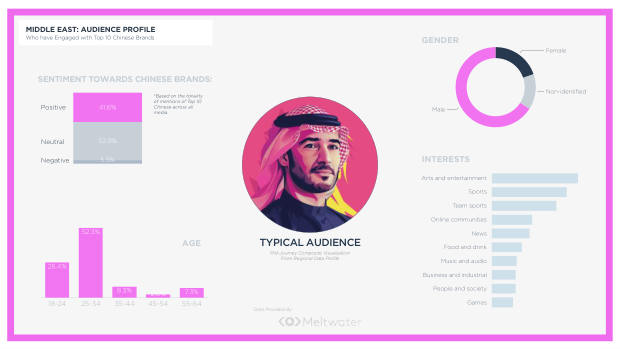
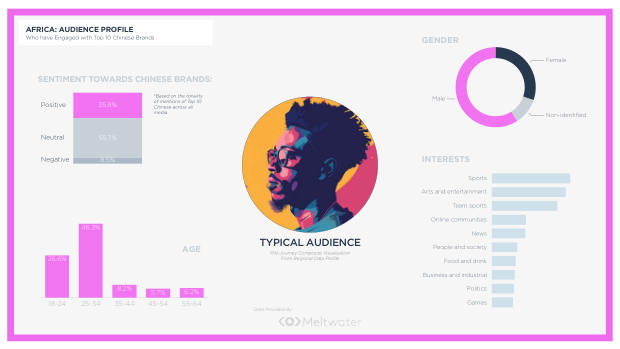
Sentiment data expose the sharpest divide. Positive sentiment toward Chinese brands runs highest in the Middle East (41.6%) and Africa (35.8%), and lowest in North America — where negative mentions (43.5%) outweigh positive (15.2%). Europe and Asia sit heavily neutral, signalling a perception still being formed rather than fixed.

100
top-ranked Chinese brands analysed across seven regions and 170+ countries
61.8%
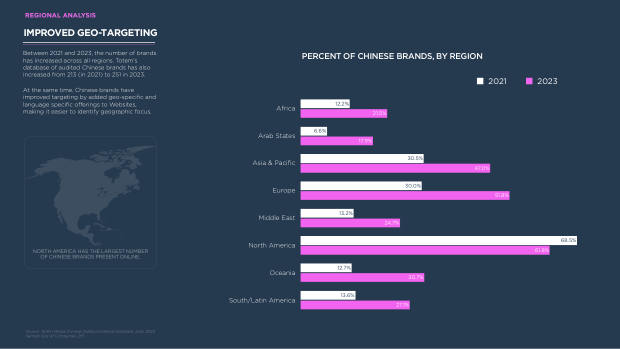
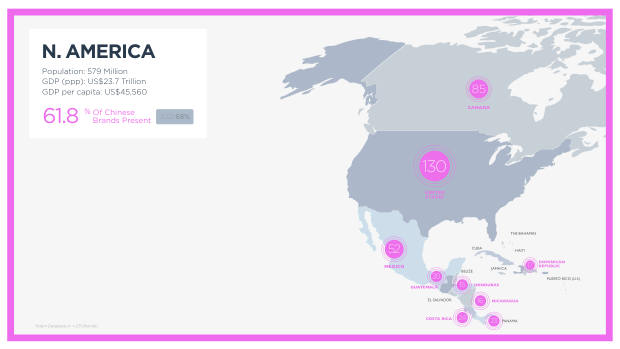
of Chinese brands have a digital presence in North America, the most of any region
51.8%
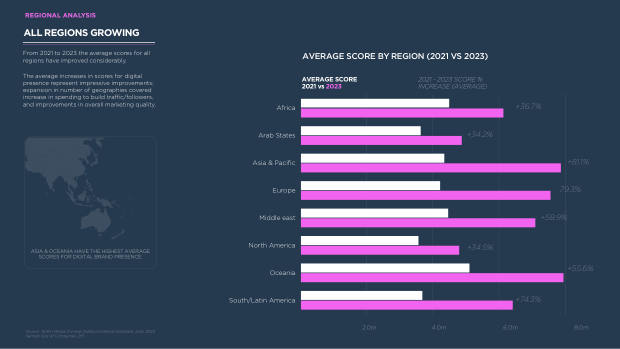
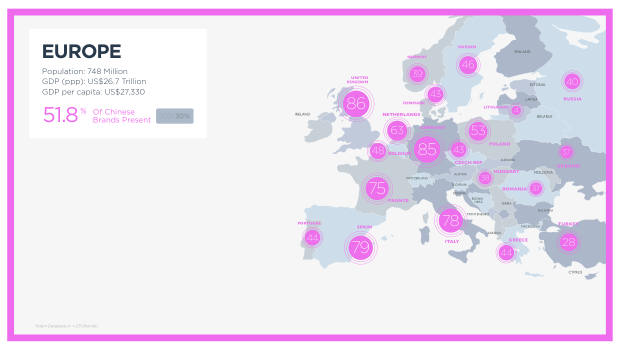
of Chinese brands present in Europe, up from 30% in 2021 (digital scores +79.3%)
41.6%
positive consumer sentiment toward Chinese brands in the Middle East, the highest of any region
43.5%
negative sentiment in North America, the highest of any region
Key findings

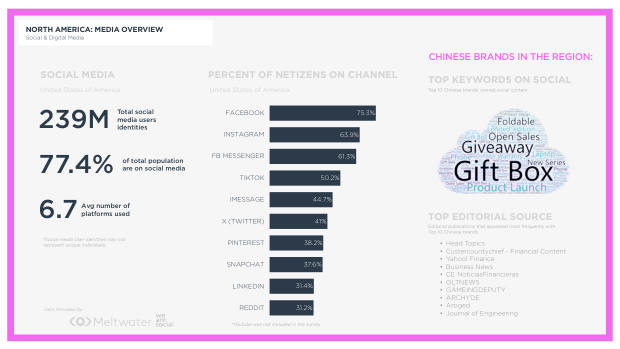
North America: the largest footprint, the coolest reception.

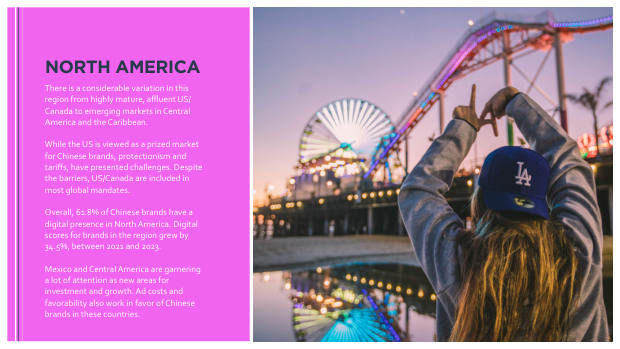
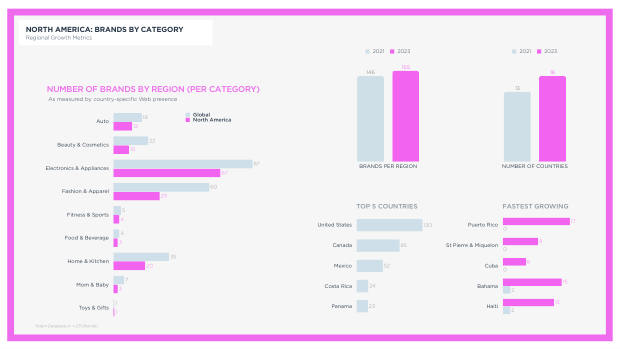
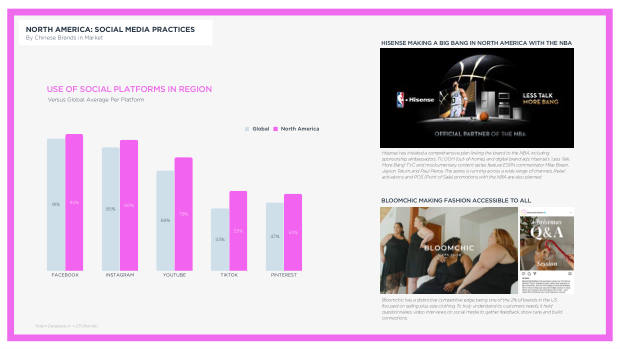
61.8% of Chinese brands have a regional digital presence and scores grew 34.5% since 2021, yet sentiment is the region's weak point — 43.5% negative against just 15.2% positive. Protectionism and tariffs are the headwinds; Mexico and Central America draw growing investment on favourable ad costs. Case in point: Hisense's NBA sponsorship programme spanning TV, OOH and digital.

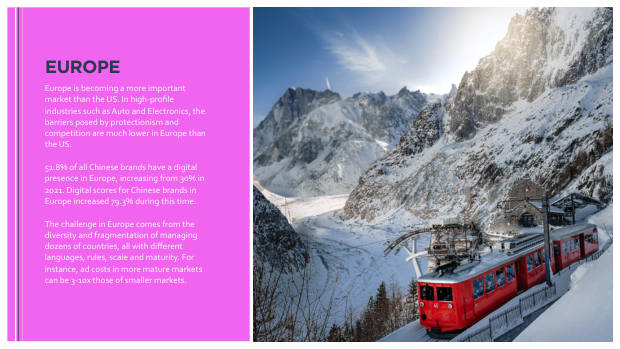
Europe is becoming more important than the US.

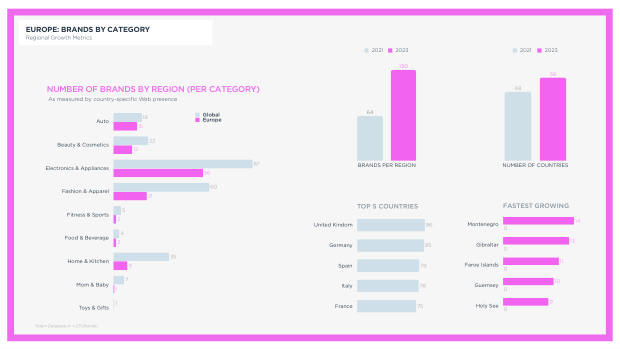
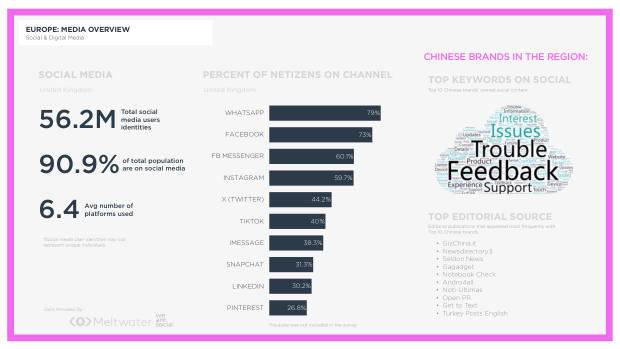
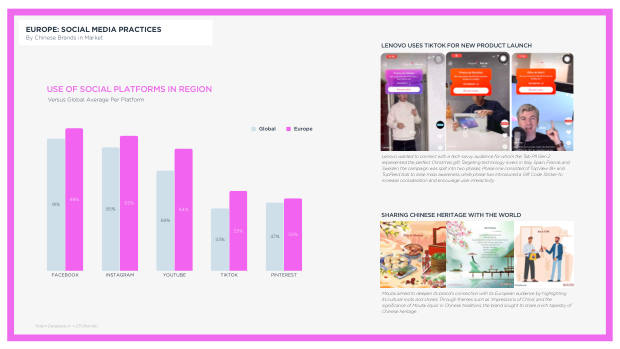
Presence rose from 30% (2021) to 51.8%, with digital scores up 79.3% — the fastest score growth of any region. Lower protectionism in auto and electronics is the draw; the challenge is fragmentation across dozens of markets where mature-market ad costs can run 3–10x smaller ones. Lenovo's multi-country TikTok launch and Moutai's heritage storytelling illustrate the localisation task.

The Middle East offers the warmest sentiment.

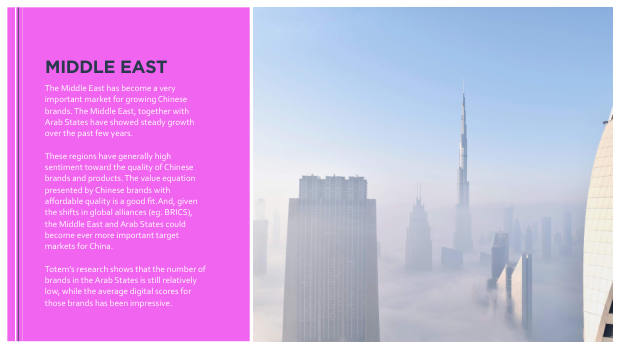
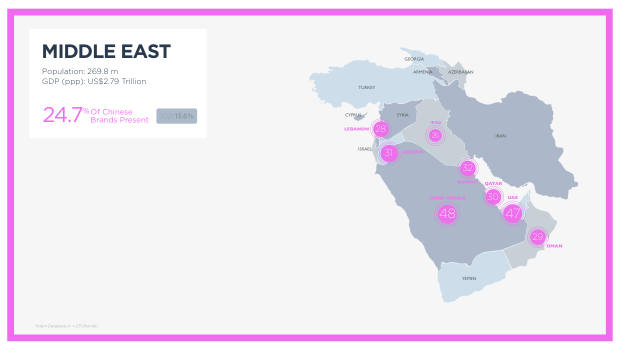
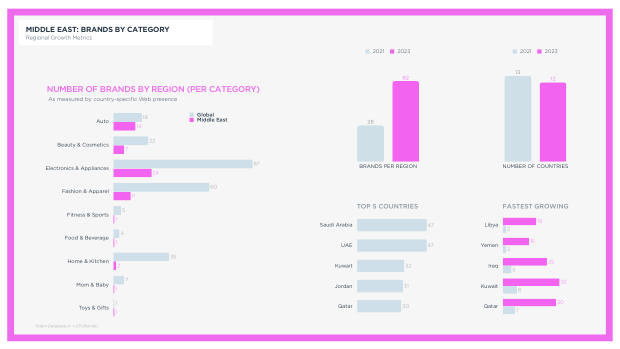
Presence reached 24.7% (from 13.6% in 2021) and positive sentiment (41.6%) leads all regions, with negativity the lowest at 5.5%. The affordable-quality value equation fits well, and BRICS-aligned shifts could make the region and Arab States steadily more important targets.

South America is favourable but still emerging.

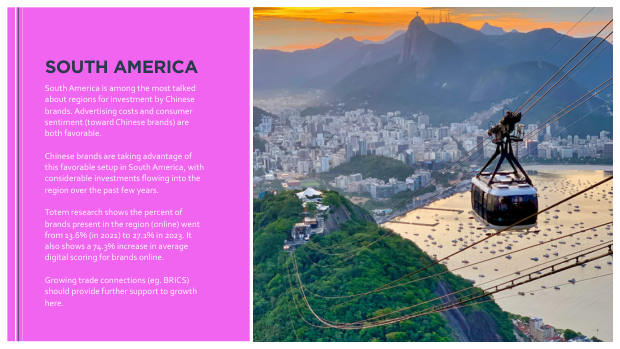
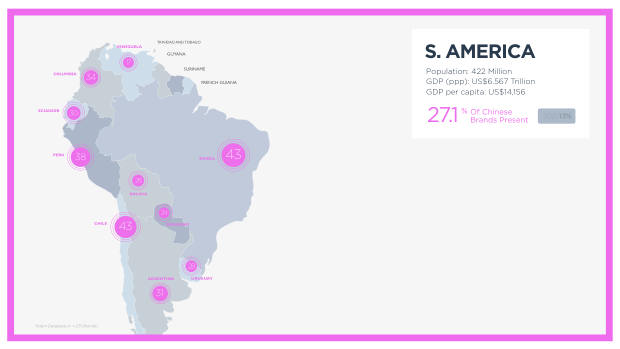
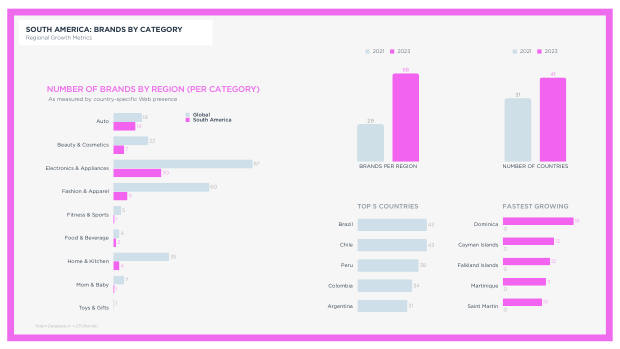
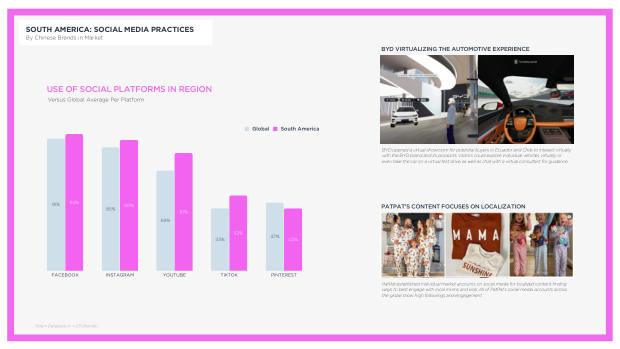
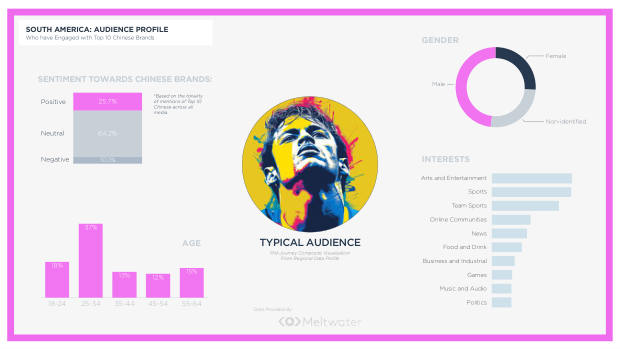
Presence more than doubled to 27.1% (from 13.6%), digital scores rose 74.3%, and sentiment is strongly positive-neutral (25.7% positive, 10.1% negative) — among the most talked-about regions for Chinese investment on favourable ad costs and BRICS trade ties. BYD's virtual showrooms in Ecuador and Chile and PatPat's market-by-market localisation are cited.

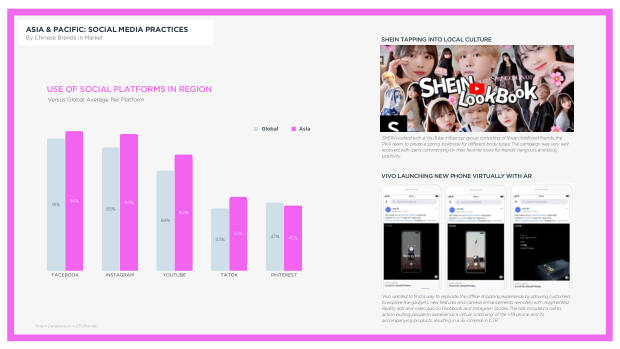
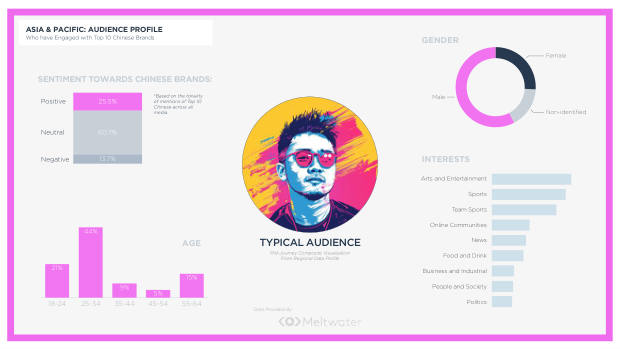
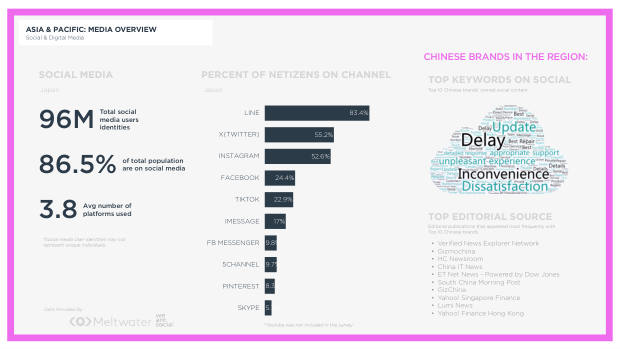
Asia & Pacific is the natural fit — under-leveraged.

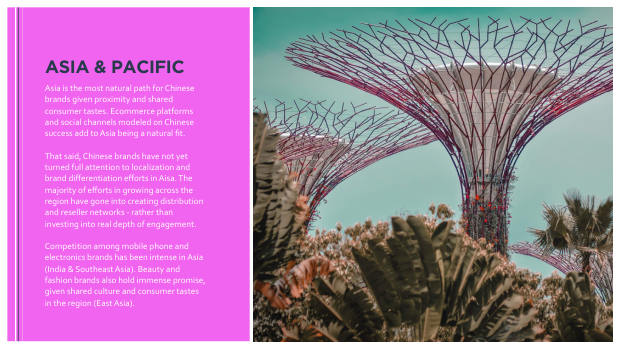
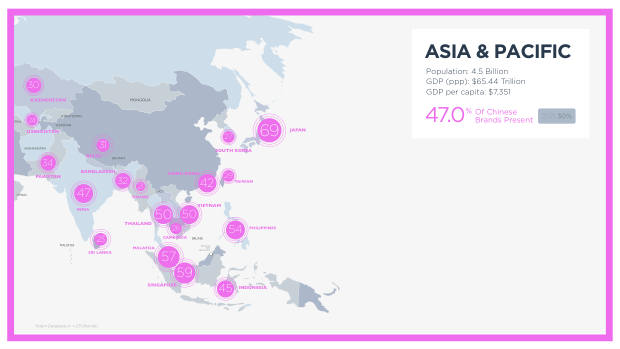
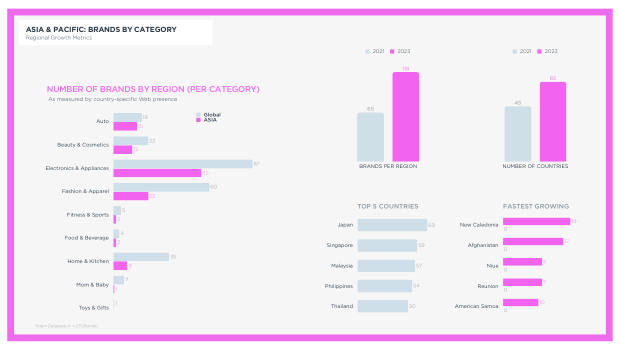
At 47.0% presence (from 30%), Asia benefits from proximity and shared tastes, but most effort has gone into distribution and reseller networks rather than deep engagement. Competition among phone and electronics brands is intense; beauty and fashion hold promise. Vivo's AR launch drove a 3x lift in click-through.

Africa: modest now, promising long-term.

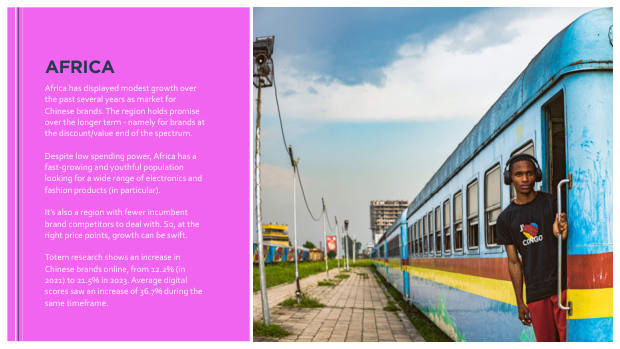
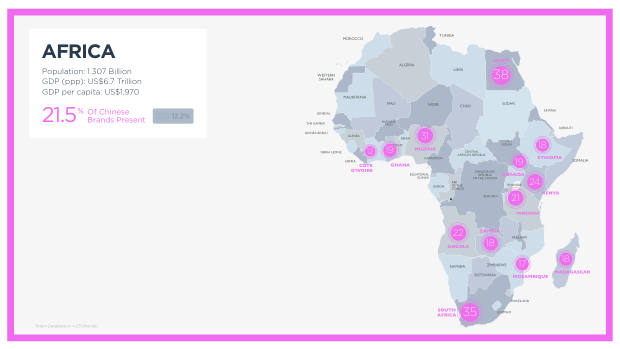
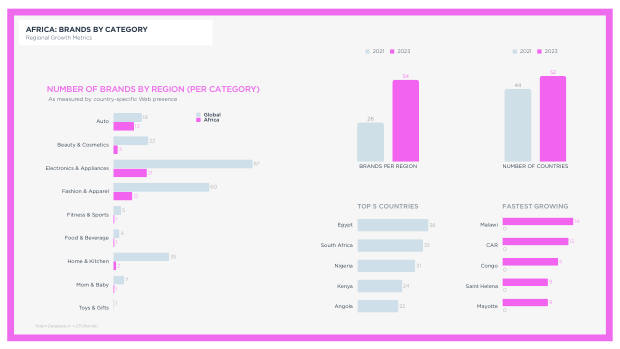
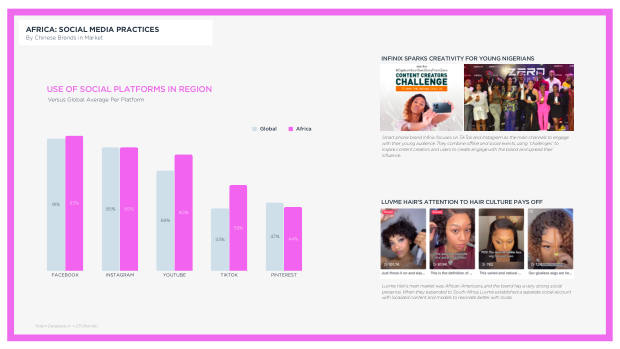
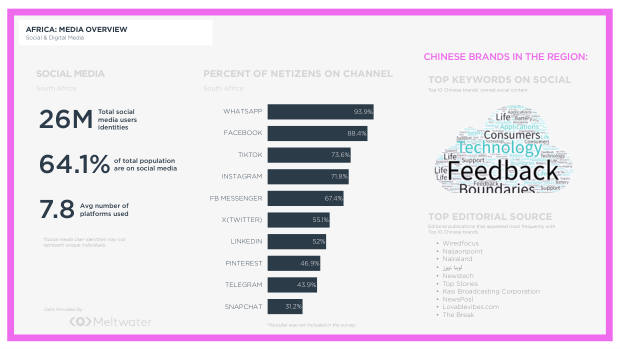
Presence rose to 21.5% (from 12.2%) with scores up 36.7%. A youthful, fast-growing, price-sensitive population and few incumbent competitors mean swift growth at the right price points — Infinix's TikTok challenges and Luvme Hair's localised South Africa account show the playbook.

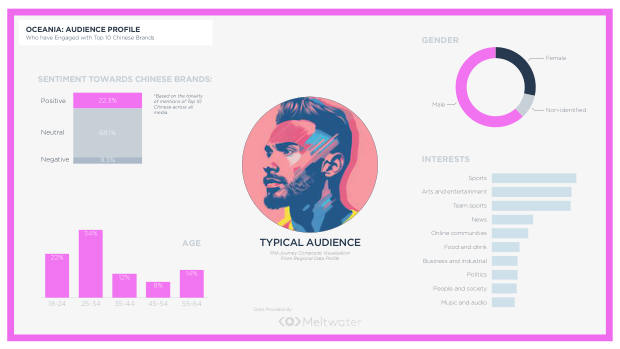
Oceania: small scale, eroding sentiment, still growing.

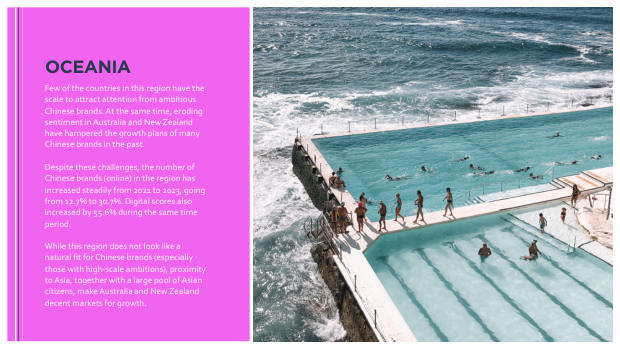
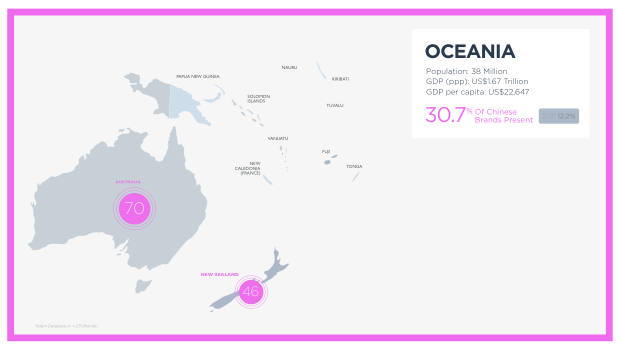
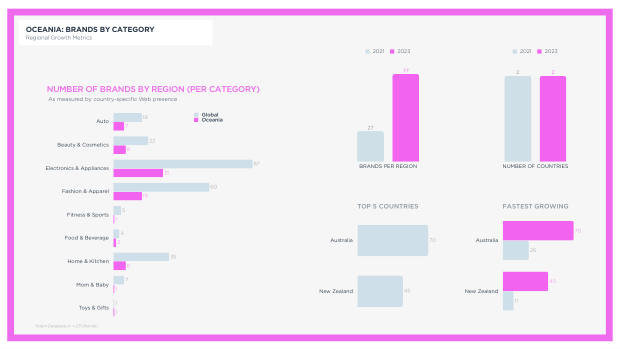
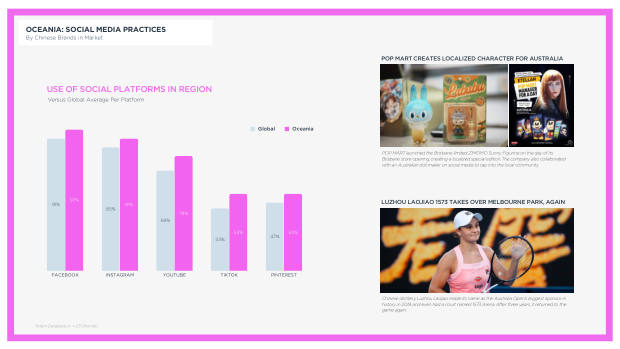
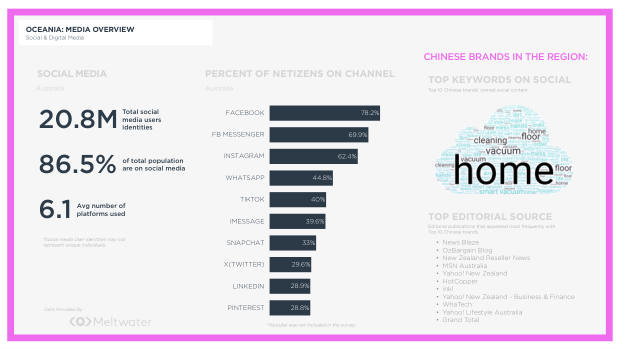
Presence jumped from 12.7% to 30.7% and scores rose 55.6%, despite eroding sentiment in Australia and New Zealand. Proximity to Asia and a large Asian-heritage population keep the two markets viable, as POP MART's Brisbane-limited edition and Luzhou Laojiao's Australian Open sponsorship demonstrate.

Localisation and influencers are the shared lever.

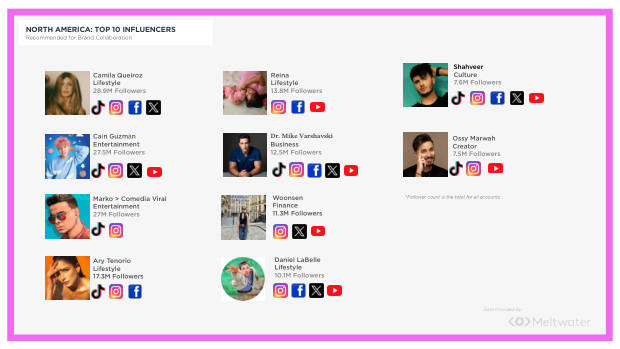
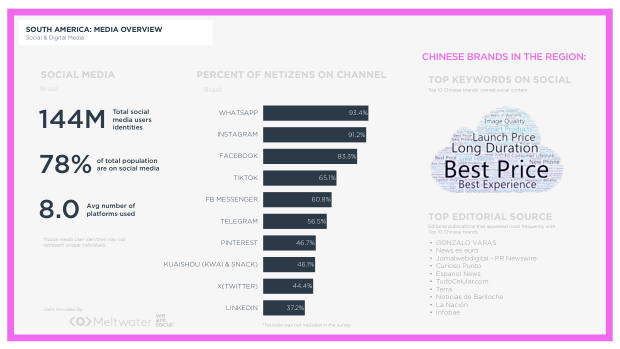
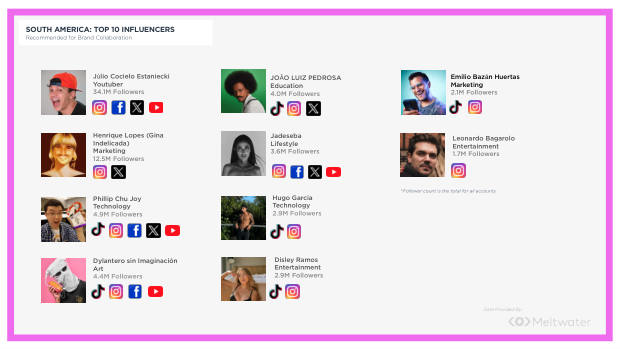
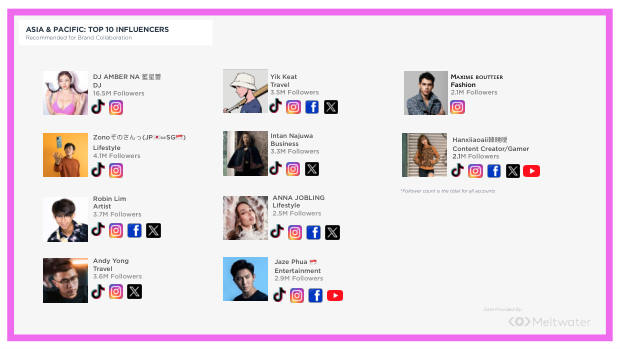
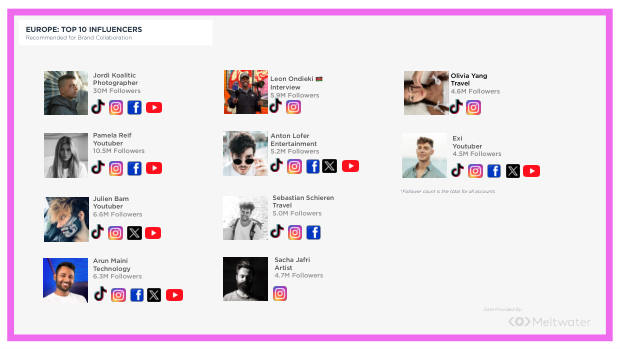
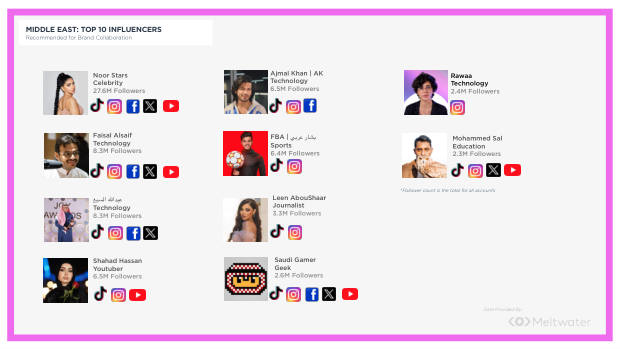
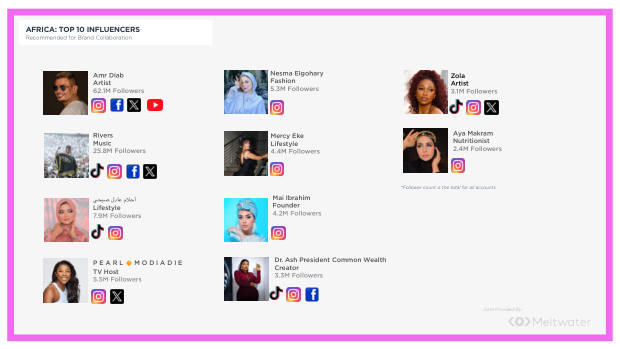
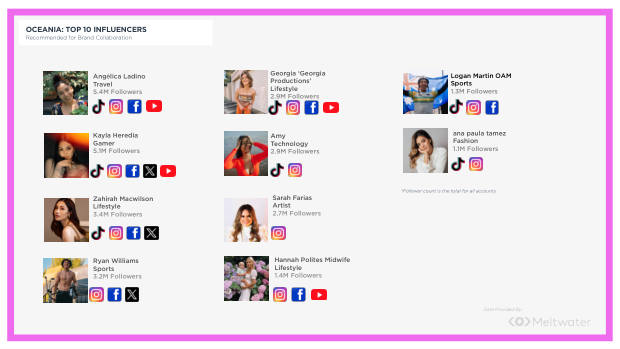
Across regions, the brands making headway build market-specific social accounts, culturally tuned content, and region-appropriate influencer rosters — the report pairs each region with recommended creator collaborations and the platforms where local netizens actually are.

Inside the report
Geographic Analysis of China's Global Brands: where they're winning, and where sentiment still resists — page 1Geographic Analysis of China's Global Brands: where they're winning, and where sentiment still resists — page 2Geographic Analysis of China's Global Brands: where they're winning, and where sentiment still resists — page 3Geographic Analysis of China's Global Brands: where they're winning, and where sentiment still resists — page 4Geographic Analysis of China's Global Brands: where they're winning, and where sentiment still resists — page 5Geographic Analysis of China's Global Brands: where they're winning, and where sentiment still resists — page 6Geographic Analysis of China's Global Brands: where they're winning, and where sentiment still resists — page 7Geographic Analysis of China's Global Brands: where they're winning, and where sentiment still resists — page 8Geographic Analysis of China's Global Brands: where they're winning, and where sentiment still resists — page 9Geographic Analysis of China's Global Brands: where they're winning, and where sentiment still resists — page 10Geographic Analysis of China's Global Brands: where they're winning, and where sentiment still resists — page 11Geographic Analysis of China's Global Brands: where they're winning, and where sentiment still resists — page 12Geographic Analysis of China's Global Brands: where they're winning, and where sentiment still resists — page 13Geographic Analysis of China's Global Brands: where they're winning, and where sentiment still resists — page 14Geographic Analysis of China's Global Brands: where they're winning, and where sentiment still resists — page 15Geographic Analysis of China's Global Brands: where they're winning, and where sentiment still resists — page 16Geographic Analysis of China's Global Brands: where they're winning, and where sentiment still resists — page 17Geographic Analysis of China's Global Brands: where they're winning, and where sentiment still resists — page 18Geographic Analysis of China's Global Brands: where they're winning, and where sentiment still resists — page 19Geographic Analysis of China's Global Brands: where they're winning, and where sentiment still resists — page 20Geographic Analysis of China's Global Brands: where they're winning, and where sentiment still resists — page 21Geographic Analysis of China's Global Brands: where they're winning, and where sentiment still resists — page 22Geographic Analysis of China's Global Brands: where they're winning, and where sentiment still resists — page 23Geographic Analysis of China's Global Brands: where they're winning, and where sentiment still resists — page 24Geographic Analysis of China's Global Brands: where they're winning, and where sentiment still resists — page 25Geographic Analysis of China's Global Brands: where they're winning, and where sentiment still resists — page 26Geographic Analysis of China's Global Brands: where they're winning, and where sentiment still resists — page 27Geographic Analysis of China's Global Brands: where they're winning, and where sentiment still resists — page 28Geographic Analysis of China's Global Brands: where they're winning, and where sentiment still resists — page 29Geographic Analysis of China's Global Brands: where they're winning, and where sentiment still resists — page 30Geographic Analysis of China's Global Brands: where they're winning, and where sentiment still resists — page 31Geographic Analysis of China's Global Brands: where they're winning, and where sentiment still resists — page 32Geographic Analysis of China's Global Brands: where they're winning, and where sentiment still resists — page 33Geographic Analysis of China's Global Brands: where they're winning, and where sentiment still resists — page 34Geographic Analysis of China's Global Brands: where they're winning, and where sentiment still resists — page 35Geographic Analysis of China's Global Brands: where they're winning, and where sentiment still resists — page 36Geographic Analysis of China's Global Brands: where they're winning, and where sentiment still resists — page 37Geographic Analysis of China's Global Brands: where they're winning, and where sentiment still resists — page 38Geographic Analysis of China's Global Brands: where they're winning, and where sentiment still resists — page 39Geographic Analysis of China's Global Brands: where they're winning, and where sentiment still resists — page 40Geographic Analysis of China's Global Brands: where they're winning, and where sentiment still resists — page 41Geographic Analysis of China's Global Brands: where they're winning, and where sentiment still resists — page 42Geographic Analysis of China's Global Brands: where they're winning, and where sentiment still resists — page 43Geographic Analysis of China's Global Brands: where they're winning, and where sentiment still resists — page 44Geographic Analysis of China's Global Brands: where they're winning, and where sentiment still resists — page 45Geographic Analysis of China's Global Brands: where they're winning, and where sentiment still resists — page 46Geographic Analysis of China's Global Brands: where they're winning, and where sentiment still resists — page 47Geographic Analysis of China's Global Brands: where they're winning, and where sentiment still resists — page 48Geographic Analysis of China's Global Brands: where they're winning, and where sentiment still resists — page 49Geographic Analysis of China's Global Brands: where they're winning, and where sentiment still resists — page 50Geographic Analysis of China's Global Brands: where they're winning, and where sentiment still resists — page 51Geographic Analysis of China's Global Brands: where they're winning, and where sentiment still resists — page 52Geographic Analysis of China's Global Brands: where they're winning, and where sentiment still resists — page 53Geographic Analysis of China's Global Brands: where they're winning, and where sentiment still resists — page 54Geographic Analysis of China's Global Brands: where they're winning, and where sentiment still resists — page 55Geographic Analysis of China's Global Brands: where they're winning, and where sentiment still resists — page 56Geographic Analysis of China's Global Brands: where they're winning, and where sentiment still resists — page 57Geographic Analysis of China's Global Brands: where they're winning, and where sentiment still resists — page 58Geographic Analysis of China's Global Brands: where they're winning, and where sentiment still resists — page 59Geographic Analysis of China's Global Brands: where they're winning, and where sentiment still resists — page 60Geographic Analysis of China's Global Brands: where they're winning, and where sentiment still resists — page 61Geographic Analysis of China's Global Brands: where they're winning, and where sentiment still resists — page 62Geographic Analysis of China's Global Brands: where they're winning, and where sentiment still resists — page 63Geographic Analysis of China's Global Brands: where they're winning, and where sentiment still resists — page 64Geographic Analysis of China's Global Brands: where they're winning, and where sentiment still resists — page 65
Questions this report answers

What does this report add to Totem's 2024 ranking?

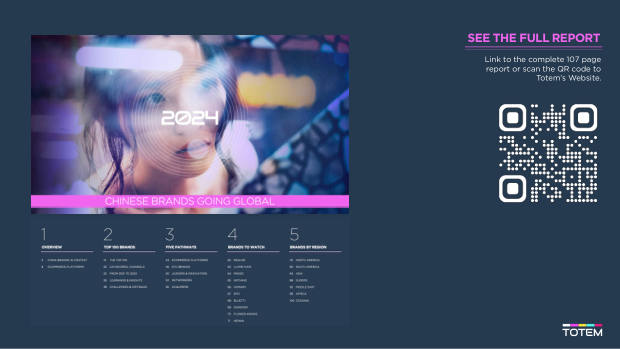
It layers Meltwater's global media data onto the existing Top 100, analysing regional presence, consumer sentiment, effective channels and influencers, and on-the-ground case studies across seven regions and 170+ countries. The full report runs 107 pages.

Which region is most receptive to Chinese brands?

The Middle East, with 41.6% positive sentiment and only 5.5% negative, followed by Africa (35.8% positive). North America is the least receptive, with negative sentiment (43.5%) exceeding positive (15.2%).

Where are Chinese brands growing fastest?

Presence grew across every region from 2021 to 2023. Europe posted the largest digital-score gain (+79.3%), while South America (+74.3%) and Oceania (+55.6%) also grew strongly off lower bases.

Which region has the most Chinese-brand presence?

North America, where 61.8% of audited brands have a digital footprint, ahead of Europe (51.8%) and Asia & Pacific (47.0%).

What data underpins the analysis?

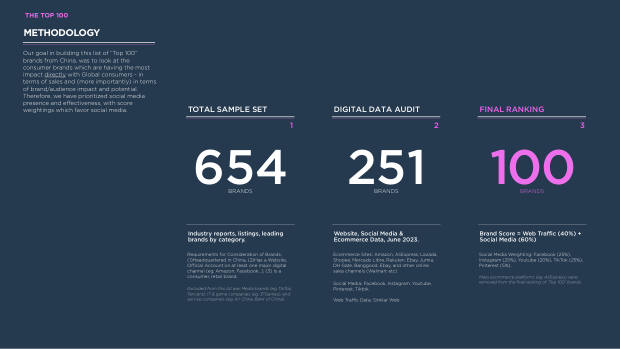
Totem's audited database of 251 Chinese brands (up from 213 in 2021), combined with Meltwater's global social, editorial and sentiment data covering seven regions and over 170 countries.

Methodology

A special report produced by Totem with Meltwater (May 2024), extending Totem's 2024 Top 100 ranking of Chinese brands going global. Using Meltwater's global data system, the study analysed the 100 top-ranked brands across seven regions and over 170 countries to assess regional presence, consumer sentiment and preferences, the most effective media and influencers per market, the topics and themes driving engagement, and case studies of what leading brands are doing to build in each region. Regional presence and digital-score changes are drawn from Totem's audited outbound-brand database (n=251 brands, June 2023; up from 213 in 2021).

Free report

Get the full report

Leave your details and we'll send the PDF to your inbox.

Your details go to Totem, never shared. Unsubscribe anytime.
← All reports